A technical blog about my projects, challenges, and discoveries in the world of data warehousing using SQL Server, Power BI Desktop, DevExpress, and more.

Tuesday, January 29, 2013

Alternating Row Background Colors in a Tablix (aka the Green Bar effect)

UPDATE on 1/31/2013: Major overhaul of technique for formatting a matrix with the "green bar" effect. The new approach requires no pre-planning for the dataset query and uses scope designations that are agnostic to the specific names of the data region.

The "green bar" effect is a document is the alternating of one background color (usually white) with another background color (originally light green) on each printed line of a document in order to make it easier to read across each line of text. The term comes from the days of impact printers with continuous feed paper that was pre-printed with just such a scheme of alternating colors, and it remains a popular method of making long lists, particularly grids, easy to read. Here is an example:


The method of formatting SQL Server Reporting Services tables with a "green bar" effect is not difficult. Formatting a matrix is only a little more difficult.

Formatting a Table
  1. In design mode, highlight all the text boxes in the (Details) section. Use a click-and-drag method to select them all in one step or hold down the Ctrl key and click each one in turn.
  2. On the Properties pane click the down-arrow for the value of the BackgroundColor property, and then click Expression...
  3. Enter the following expression. If you want colors other than white and light green, substitute your own color choices.

    =IIf(RowNumber(Nothing) mod 2 = 0, "LightGreen", "White")
The Mod function applies "modulo division," which returns the remainder of the division. All even numbers have a remainder of zero when divided by 2, so the IIF() function will return "true" for even numbers and "false" for odd numbers, resulting in the two different colors being applied to the background of the text box. That's all there is to it for a table. A matrix is a little more involved.

Formatting a Matrix
  1. Create your matrix, and then right-click on the left-most column and select Insert Column > Inside Group - Left.
  2. On the bottom-left text box of the matrix, which was just created when you added the new column, right-click and select Text Box Properties...
  3. Change the Name property to RowNumber.
  4. Enter the following expression as the Value property:

     =RunningValue(Min(1), Sum, Nothing)
     
  5. Click OK to confirm the new settings for the text box.
  6. If you do not want the running count of rows to appear in your final matrix, click on the tablix column marker to select the entire column. Then use the Properties pane to change the Hidden property to True.
  7. Click on the text box that will show the aggregate data for your matrix (in an Excel PivotTable this would be called the "data region" cell).
  8. On the Properties pane click the drown-arrow for the value of the BackgroundColor property, and then click Expression...
  9. Enter the following expression.

    =IIf(ReportItems!RowNumber.Value mod 2 = 0, "LightGreen", "White")
If you want the row labels to alternate with the same colors, merely repeat the same formula for the background color of the row label text box(es) as well.

Tuesday, January 22, 2013

Check Database Size against SQL Server Express Size Limit

NOTE: This is a re-post of the same topic that is soon to be published in our SSTips forum of the Shelby Community site. I want to share the information with a wider audience than just the Shelby Systems, Inc. customer base, so I am posting it here too, with only minor edits for form and content. Also I want to acknowledge the contribution of Thomas LaRock, whose blog post on autogrowth settings provided the inspiration for some of the code in the query solution I give below.
If you use the free Express edition of SQL Server (like the one that is bundled with the Shelby v.5 installation software), then there is an upper limit on how large your database files can be. (SQL Server Standard Edition has an upper limit of 524 Petabytes -- effectively no limit at all -- but it is not free.) If your database reaches the limit of your SQL Server Express version, you will begin to experience errors due to the inability of the database tables to accept new data. It can be expensive and time-consuming to correct this problem once it occurs. Here is a brief chart of the Express versions and their size limits:
  • 2000 Desktop - 2 GB
  • 2005 Express  - 4 GB
  • 2008 Express  - 4 GB
  • 2008 R2 Express - 10 GB
  • 2012 Express - 10 GB
Run the query below in ShelbyQUERY or in SQL Server Management Studio (SSMS) to identify your SQL Server version and edition and also to let you know if you are reaching the upper limit of its capacity.  An explanation of the columns returned by this query follows the query statement.

select
 SQL_Server_Version = @@version,
 SQL_Server_Edition = serverproperty('Edition'),
 SQL_Server_Name = serverproperty('ServerName'),
 Database_Name = a.Name,
 Maximum_Database_Size_MB = case when serverproperty('EngineEdition') in (1, 4) then case when cast(serverproperty('ProductVersion') as nvarchar(128)) like '8.%' then '2048 MB' when cast(serverproperty('ProductVersion') as nvarchar(128)) like '9.%' then '4096 MB' when cast(serverproperty('ProductVersion') as nvarchar(128)) like '10.0%' then '4096 MB' else '10240 MB' end else 'Effectively no limit' end,
 Data_Size_MB = convert(decimal(12,2),round(fileproperty(a.name,'SpaceUsed')/128.000,2)),
 Available_Growth_MB = case when serverproperty('EngineEdition') in (1, 4) then case when cast(serverproperty('ProductVersion') as nvarchar(128)) like '8.%' then 2048 when cast(serverproperty('ProductVersion') as nvarchar(128)) like '9.%' then 4096 when cast(serverproperty('ProductVersion') as nvarchar(128)) like '10.0%' then 4096 else 10240 end end - convert(decimal(12,2),round(fileproperty(a.name,'SpaceUsed')/128.000,2))
from
 sys.sysfiles a
where
 a.name not like '%_log';


  • SQL_Server_Version - a verbose description of the version, edition, and other properties of your SQL Server environment
  • SQL_Server_Edition - the edition of SQL Server
  • SQL_Server_Name - the name (including instance) of SQL Server
  • Database_Name - the name of your database
  • Maximum_Database_Size_MB - for Express editions, the upper limit of the size of the database, measured in Megabytes; for Standard editions, "Effectively no limit"
  • Data_Size_MB - the amount of data stored in the database, measured in Megabytes. This is the critical number.  If this number ever equals the value shown for the Maximum_Database_Size_MB, the Shelby v.5 software will start throwing errors whenever new values are entered because there will be no room to store them in the database.
  • Available_Growth_MB - the difference between the maximum database size and the current data size; when this reaches zero, trouble will begin.

If you are a Shelby v.5 customer and you discover that you are about to max out your database size, there are some things you can do about it. Read the SSTip post in the Shelby Community (to be posted February 1, 2013) for suggestions.

Thursday, January 17, 2013

SSRS 2008 R2 Gotcha: Default Multi-valued Parameters

Recently a customer contacted me with a mysterious symptom in SQL Server Reporting Services (SSRS): a report displayed different results in VisualStudio than it did in Report Manager. He had verified the data source was the same for both contexts. He had verified that the RDL file was identical in both contexts. All the user-selected parameters were identical. And yet in Visual Studio certain values were included in the output that were not appearing when the exact same report ran in Report Manager. He had redeployed this report several times while troubleshooting, with no change in the output of the report in Report Manager.

After I connected to his system with a remote assistance session, I started drilling down through the report management options in Report Manager (report > Manage). I discovered that there were a couple of hidden parameters in the report design, and shortly after that I discovered that one of the hidden parameters was a multi-select parameter for which the Visual Studio report had two values selected by default and the Report Manager had only one.

Apparently the Report Manager context had cached the default setting for the parameter with one value only and redeploying the report did not change the setting. The only method we found that could fix the hidden parameter was to manually update it in the Report Manager context. Only then did the online report output match the offline report output in Visual Studio.

Later I tested the process by deploying a report that had a multi-valued parameter that used a query to select all the possible values by default. This parameter was not hidden. This report deployed normally and showed the parameter as having a default that was generated by query, the correct setting. But then I altered the report in Visual Studio to have a manually-defined default value instead of a query-based value. When I deployed the report and checked it again in Report Manager, the parameter had no default value at all. Changing the default value to a different manual value and redeploying had no effect; the online report continued to have no default value defined.

The bottom line appears to be that in SSRS 2008 R2 setting manual default values for a multi-valued parameter in Visual Studio is not a guarantee that the deployed report will have the same values set as defaults. The only way to be sure you have the correct manual default values for multi-valued parameters is to set them using the the Parameters property of the online report in Report Manager.

Monday, January 7, 2013

Repeating Headers in SSRS

Getting header rows to repeat in SQL Server Reporting Services (SSRS) is surprisingly tricky. This is due at least in part to the ambiguous use of the term "header" in the SSRS context. In some cases it refers to any row that is above the core data-driven section of a tablix item. In other cases it refers only to a group header row. Hopefully the explanations below will clarify things a bit.

NOTE: In all the examples to follow I will use a typical data source and a dataset, but I am only going to show screenshots of the tablix structure and options related to the topic of repeating headers. The actual data are moot to the process of getting the headers to repeat.

Before exploring the solutions for repeating headers, I will walk through steps to highlight the cause of much frustration with it comes to trying to make headers repeat. 

Step 1: Add a table to your report. Notice that the top row of the table is labeled "Header."

Step 2: Add whatever fields you want to the data row.
Step 3: Open the tablix properties of the table. Put a check mark next to "Repeat header rows on each page." Click OK.

Step 4: Run the report. Notice that the header rows do not repeat on each page!

This is the usually the beginning point of frustration with making header rows repeat. It has caused me (and probably others too) to shout at the computer, "Why aren't you doing what I'm telling you to do?!?!"

[Spoiler: "Repeat header rows on each page" doesn't really mean what it says. It means, "Repeat the header region of a row group on each page whenever the content is too wide to fit on one page and generates one or more extra pages." I guess that was too much verbiage for the programmers to fit.]

The following steps explain how to get Reporting Services to do what you want it to do and repeat the information you want repeated.

Repeat Rows or Columns for a Table with No Groups

A static row is any row that is outside of any data-driven section of the tablix. This means it is not the (Details) row and it is not inside any bracketed "grouping" section either. The tablix marker that appears to the left of the row is completely empty, as shown below.

Normally static rows do not appear as items in the Row Groups section at the bottom of the design screen, but to make them repeat we need to see them. So use the drop-down choice to the right of the Column Groups label and select "Advanced Mode" to turn it on.


Click on the (Static) item under the Row Groups pane that corresponds to the row you want to repeat. Then switch to the Properties pane (press F4 to open the Properties pane if it is not already open).

Change or verify these property values:

  • FixedData to True (to "freeze" the row in a web browser environment; this is optional)
  • KeepWithGroup to After (this may be the default, but it can be changed inadvertently)
  • RepeatOnNewPage to True


Now the row will repeat on each new page of the report output.

If there are too many columns to print on one page, you can also choose to repeat (and freeze) one or more columns on each page. Simply make the same change to the column's (Static) item under Column Groups that is shown above for the static row.

Repeat Rows and Columns in a Table with Row Groups

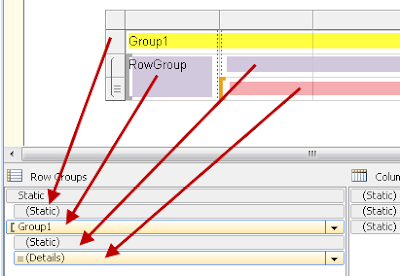
When you add a row group to a tablix, a vertical double-dashed line divides the table and a bracket appears on the tablix frame to show the rows within the group. Within the group bracket, the region to the left of the double-dashed line is the "row header" region. To the right of the double-dashed line is the details region and, if you added a row group header, a static row (technically only a partial row) above the details region. The diagram below shows each region with arrows pointing to the corresponding item in the Row Groups pane. As mentioned above, to see the (Static) items, the pane must be in Advanced mode.


All static rows, including the partial header row inside the group, can be repeated on each page using the technique explained above. The row header region will reprint the field value at the top of each page by default, so normally there is nothing you need to do with it. However, if you have too many columns to fit the page, you can also repeat the row header region on the pages with the excess horizontal content. To do this, open the tablix properties and put a check beside "Repeat header rows on each page." (Of course it is not "rows" that are repeated but the row header column. This is part of what makes the option unclear.) If you want the row header region to stay on the screen when the report user scrolls horizontally, also check the box to "Keep header visible while scrolling."


Repeats Rows and Columns in a Table with Column Groups

Like a row group, a column group in a table (or matrix) also has a double-dashed line dividing the details region below the line from the column header region above the line. Making static rows and columns (or the partial "header" segments that are also static) works just as described above for static items. Making the column header region repeat works like making the row header repeat: open the tablix properties and select "Repeat header columns on each page." (Again, it is not "columns" that repeat but the column header row. This just maintains the confusion.) When you are dealing with a matrix (which is really just a table with row groups and column groups together), this is normally the option you want to choose to make sure the columns are labelled on every page. But this is not intuitive because the wording leaves you to believe that columns will be repeating, not the header row. 

Summary

Hopefully this post will help you take control of the headers you want to repeat across the pages of your report, both in print on on the screen. Here is a brief list of points to take from the discussion:
  • The tablix properties for repeating headers refer only to group-header regions and have no effect on other rows or columns in the tablix.
  • The phrases "header rows" and "header columns" in the tablix properties screen are misleading and basically mean the opposite of what they seem.
  • To make non-group-header rows or columns repeat, first turn on the "Advanced" mode of the group pane at the bottom of the design screen, then set the properties of the corresponding (Static) item so that RepeatOnNewPage and FixedData are both true.

Followers