
A technical blog about my projects, challenges, and discoveries in the world of data warehousing using SQL Server, Power BI Desktop, DevExpress, and more.

Monday, January 7, 2013

Repeating Headers in SSRS

Getting header rows to repeat in SQL Server Reporting Services (SSRS) is surprisingly tricky. This is due at least in part to the ambiguous use of the term "header" in the SSRS context. In some cases it refers to any row that is above the core data-driven section of a tablix item. In other cases it refers only to a group header row. Hopefully the explanations below will clarify things a bit.

NOTE: In all the examples to follow I will use a typical data source and a dataset, but I am only going to show screenshots of the tablix structure and options related to the topic of repeating headers. The actual data are moot to the process of getting the headers to repeat.

Before exploring the solutions for repeating headers, I will walk through steps to highlight the cause of much frustration with it comes to trying to make headers repeat. 

Step 1: Add a table to your report. Notice that the top row of the table is labeled "Header."

Step 2: Add whatever fields you want to the data row.
Step 3: Open the tablix properties of the table. Put a check mark next to "Repeat header rows on each page." Click OK.

Step 4: Run the report. Notice that the header rows do not repeat on each page!

This is the usually the beginning point of frustration with making header rows repeat. It has caused me (and probably others too) to shout at the computer, "Why aren't you doing what I'm telling you to do?!?!"

[Spoiler: "Repeat header rows on each page" doesn't really mean what it says. It means, "Repeat the header region of a row group on each page whenever the content is too wide to fit on one page and generates one or more extra pages." I guess that was too much verbiage for the programmers to fit.]

The following steps explain how to get Reporting Services to do what you want it to do and repeat the information you want repeated.

Repeat Rows or Columns for a Table with No Groups

A static row is any row that is outside of any data-driven section of the tablix. This means it is not the (Details) row and it is not inside any bracketed "grouping" section either. The tablix marker that appears to the left of the row is completely empty, as shown below.

Normally static rows do not appear as items in the Row Groups section at the bottom of the design screen, but to make them repeat we need to see them. So use the drop-down choice to the right of the Column Groups label and select "Advanced Mode" to turn it on.


Click on the (Static) item under the Row Groups pane that corresponds to the row you want to repeat. Then switch to the Properties pane (press F4 to open the Properties pane if it is not already open).

Change or verify these property values:

  • FixedData to True (to "freeze" the row in a web browser environment; this is optional)
  • KeepWithGroup to After (this may be the default, but it can be changed inadvertently)
  • RepeatOnNewPage to True


Now the row will repeat on each new page of the report output.

If there are too many columns to print on one page, you can also choose to repeat (and freeze) one or more columns on each page. Simply make the same change to the column's (Static) item under Column Groups that is shown above for the static row.

Repeat Rows and Columns in a Table with Row Groups

When you add a row group to a tablix, a vertical double-dashed line divides the table and a bracket appears on the tablix frame to show the rows within the group. Within the group bracket, the region to the left of the double-dashed line is the "row header" region. To the right of the double-dashed line is the details region and, if you added a row group header, a static row (technically only a partial row) above the details region. The diagram below shows each region with arrows pointing to the corresponding item in the Row Groups pane. As mentioned above, to see the (Static) items, the pane must be in Advanced mode.
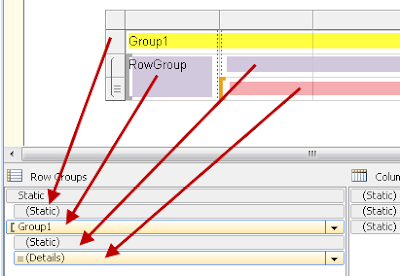

All static rows, including the partial header row inside the group, can be repeated on each page using the technique explained above. The row header region will reprint the field value at the top of each page by default, so normally there is nothing you need to do with it. However, if you have too many columns to fit the page, you can also repeat the row header region on the pages with the excess horizontal content. To do this, open the tablix properties and put a check beside "Repeat header rows on each page." (Of course it is not "rows" that are repeated but the row header column. This is part of what makes the option unclear.) If you want the row header region to stay on the screen when the report user scrolls horizontally, also check the box to "Keep header visible while scrolling."


Repeats Rows and Columns in a Table with Column Groups

Like a row group, a column group in a table (or matrix) also has a double-dashed line dividing the details region below the line from the column header region above the line. Making static rows and columns (or the partial "header" segments that are also static) works just as described above for static items. Making the column header region repeat works like making the row header repeat: open the tablix properties and select "Repeat header columns on each page." (Again, it is not "columns" that repeat but the column header row. This just maintains the confusion.) When you are dealing with a matrix (which is really just a table with row groups and column groups together), this is normally the option you want to choose to make sure the columns are labelled on every page. But this is not intuitive because the wording leaves you to believe that columns will be repeating, not the header row. 

Summary

Hopefully this post will help you take control of the headers you want to repeat across the pages of your report, both in print on on the screen. Here is a brief list of points to take from the discussion:
  • The tablix properties for repeating headers refer only to group-header regions and have no effect on other rows or columns in the tablix.
  • The phrases "header rows" and "header columns" in the tablix properties screen are misleading and basically mean the opposite of what they seem.
  • To make non-group-header rows or columns repeat, first turn on the "Advanced" mode of the group pane at the bottom of the design screen, then set the properties of the corresponding (Static) item so that RepeatOnNewPage and FixedData are both true.

Sunday, December 2, 2012

SQL Saturday Coming Soon!

In just six days I'll be presenting at SQL Saturday #173 in Washington, DC.  If you are in the area and can make it, I hope to see you in my session on avoiding SQL Server Reporting Services annoyances. SQL Saturdays are free events and are the best one-day SQL Server training events I know.

SQL Saturday #173 will have two tracks on Business Intelligence and Analysis Services, two on DBA topics, one for T-SQL developers, and one on personal development. The agenda is packed with great topics. For example, right after my session is over I'm heading over to hear about advanced charting techniques in SSRS presented by Jason Thomas.

Not only are the sessions rich in information, but so are the door prizes. Last year I won the book SQL Server Reporting Services Recipes, and I've used it many times since. Crossing my fingers for an equally good prize this year!

Even if you can't make it up to DC this coming Saturday, consider coming to SQL Saturday #187, which is right here in Richmond, VA! This will be our second SQL Saturday in the city, and the Richmond SQL Server User Group is psyched to bring this event to Richmond again. Jessica Moss and Kevin Kline have already signed up as speakers, and that's just the beginning of what should be a powerful slate of presenters.

Hope to see you Saturday!

Sunday, November 11, 2012

Top 10 Things I Learned While NOT at PASS 2012

Last week was the PASS Summit in Seattle, Washington. I was unable to attend this year, but I watched the keynote addresses on PASS TV, a live streaming video feed from the conference. Normally I post a "Top 10 Things I Learned" from each day of the Summit. Because I didn't go this year, I didn't do this. But that is not to say I learned nothing last week. In fact, I spent last week developing my first functioning "data mart" for one key area of the Shelby v.5 application: GlobaFILE. GlobaFILE is the core repository of names and name-related data. It does not have any true data warehouse style "facts" in it, such as financial transactions, but it does serve as the basis of core name content for all other modules apart from the General Ledger. The biggest bonus to creating this data mart is the ability to capture changes over time, which is by itself a pretty big win for historical analysis.

While I learned last week is a combination of aspects of SSIS, T-SQL, and news from PASS during the keynote addresses. Without further ado, here are my top 10, in no particular order:

1. SSIS: I learned that most of the expressions used in SSIS are based on C# syntax rather than on SQL or VB.NET. This was a frustration because it is yet another language syntax I will need to learn in order to work effectively in SSIS.

2. SSIS: Most of the data transformation I need to do from my OLTP database to the as-yet-in-design OLAP database cannot be done with the basic SSIS data tasks. I would need to use C# conditional statements and VB.NET scripts together to achieve the result. But by the same token, I can do most of the data transformation with T-SQL in queries. So right now I'm not certain if SSIS is really an essential part of the development of a Shelby v.5 data warehouse solution, especially in light of the next Top 10 item.

3. T-SQL: The MERGE command in T-SQL can populate slowly changing dimensions and facts in the data mart. I am glad that I already knew how to create Common Table Expressions prior to attempting to populate my data mart database using MERGE. The CTEs are where the data extraction and transformation take place, and the MERGE statement itself is where the data are loaded into the data mart tables.

4. T-SQL: Define the surrogate key column of a fact or dimension table with the "identity" property so that it will auto-increment a new value for every new row. For a dimension table, specify 0 as the first value for the "identity" assignment, thus enabling a manual INSERT query to populate the "N/A" row.

5. T-SQL: Define a "trigger" on a dimension table in order to automatically assign a "RowEnd" date to any row that is supplanted with a new row with the identical business key.

6. T-SQL: Use calculated columns to make explicit some data that are stored implicitly in other columns but which will make the end-user's experience much easier to have at hand, such as "age" and "RowCurrent."

7. SSIS: Unless I'm missing something, deploying solutions from SSIS to a production server context is much more difficult than deploying reports in SSRS to the Report Manager. This is another reason that I am currently preferring using MERGE over SSIS.

8. KEYNOTE ANNOUNCEMENT: Microsoft is in development of an enhancement to SQL Server 2012 called "Hekaton" that will optimize selected tables and procedures so that they run completely in memory, yielding improvements in efficiency of one to two orders of magnitude.

9. KEYNOTE ANNOUNCEMENT: Excel 2013 includes a completely stand-alone instance of Power View visualization reporting. This is huge. This means that some reporting options that were reserved only for owners of SQL Server Enterprise AND SharePoint Enterprise are not available to any owner of Excel 2013. I found Office 2013 available on TechNet downloads, and I can't wait to get it installed and make sure I understood the announcement correctly. If I did, this could be a game changer for reporting at all levels, including for the churches who use Shelby v.5 and Microsoft Office.

10. BONUS: It pays to tweet. As part of a Twitter contest sponsored by PASS, I tweeted what I liked best about PASS Summit 2012 (which was the PASS TV live feed of certain sessions of the Summit). And I was one of two winners of the contest! :-) I don't yet know what I won, but I'm hoping for the USB key with videos of all the sessions of the Summit on it. It's a long shot, since that's listed as a "grand prize," but I'm keeping my fingers crossed until I hear something, hopefully this week!

Next year PASS will be in Charlotte, North Carolina, and I'm definitely planning on going next year. My next PASS event is coming up much sooner: I'm speaking next month at SQL Saturday in Washington, D.C. on December 8th. Hope to see you there!

Thursday, September 27, 2012

Bit and Sum() in Reporting Services

The bit data type is normally used to record Boolean true/false data, with a 0 for false and a 1 for true. It might also represent yes/no data, with a 0 for no and a 1 for yes. When it comes to reporting on this type of data, it is normally represented with a checkbox or a word. It is not normally an additive value.

But consider the circumstance of an attendance history table with a bit column for "attended" paired with a column for a "person_id" and a "date." In a report it would be logical to add up the "attended" column values to arrive at a "times attended" total. And that is exactly what I recently tried to do, only to discover what I am about to share.

In SQL Server Management Studio (SSMS), the bit data type is represented in the results display by a 0 or a 1. If you try to put a bit column into a SUM() aggregate function, you will receive an error message that lets you know that the bit type is invalid for the SUM() operator. But that is not a big problem because you can CAST the data type into tinyint, and then it adds up to yield a positive number that is the sum of all the 1s and 0s in the included set of rows.

By contrast, in Business Intelligence Development Studio (aka BIDS - Visual Studio optimized for Reporting Services), the bit data type is represented by the words True and False. Just like in SSMS, if you try to put a bit data type in a Sum() function, you will receive an error. Once again this seems like no big deal because you can use CInt() to convert the data type to an integer.

But here's the rub: BIDS considers a "true" bit to be a -1, not a 1. That means the Sum() of a converted bit data type will be a negative number that is the sum of -1s and 0s in the included set of rows.

I discovered this when my formula for "percent attended" was yielding negative values even though, when I checked the numbers in SSMS, all I saw were positive numbers. It took a little digging to figure out that SSMS and BIDS where interpreting "True" in equal but opposite ways (1 and -1 respectively).

So the conclusion is this: if you are going to use a bit data type as an additive value in BIDS and Reporting Services, convert it first in the SQL statement to a tinyint data type. That will keep everything positive.

Thursday, April 12, 2012

PowerPivot DAX Language Gotchas

Recently I was working on a handout for the International Shelby Conference coming up in June. The topic for the session is PowerPivot, a new way of accessing data to underlay PivotTables and PivotCharts. I have used PowerPivot very occasionally since its release a few years ago, but I had never utilized the "Data Analysis Expression" language, aka DAX, that is part of the tool. DAX is a formula language akin to the formula language that is part of a basic Excel worksheet. But it has many new functions that are designed to apply to entire tables and to columns of tables, rather than just to individual cells and groups of cells. I wanted to include a couple of examples of the DAX language in my presentation, so I dove in. Almost immediately I hit some snags and got errors and unexpected results. I eventually worked through the issues I was having, and I learned some things about DAX in the process. So here is a summary of what I learned in my first foray into the world of DAX.


  • There are two places to create DAX-calculated output for the PivotTable: calculated columns added to the source tables in the PowerPivot window and measures added directly to the PivotTable in the Excel window. 
The first one I knew about already. Whenever you load a table into the PowerPivot window, there is an "Add New Column" spot to the right of the existing columns in the table. Just give the column a name and add the DAX formula, and off you go. The new column will act like a native column of data whenever you go to the PivotTable (or PivotChart) report. Where this was a "gotcha" was my lack of awareness of measures. I was frustrated for awhile when I was trying to use DAX formulas in calculated columns that only work properly as measures.

Some of the most powerful analysis solutions using DAX are in measures, not in calculated columns. This is because the formulas in measures can transcend the natural "filters" of the PivotTable to show data beside or beyond the context of the position in the PivotTable. As one example, the PREVIOUSYEAR() function in DAX can allow a cell in a PivotTable to show data from the year prior to the one active for a given cell. Although the same data can be achieved through the design of the PivotTable, with DAX measures the user has more control over how the data will appear in the results.
  • There are no explicit conversion functions in DAX.
If the system cannot make an implicit conversion of the data, you're stuck. This is a key bit of information to keep in mind as you think about calculated columns and measures. If you want to do some kind of manipulation of the data that requires a particular data type, make sure the underlying data in the source tables are of the correct type before you get to the DAX context. This probably means using a SQL query to "clean" the data in a view before you import it into PowerPivot.
  • The filter parameters used with some DAX functions can implicitly "ignore" the context defined by row and column position inside the PivotTable, but they cannot implicitly ignore the context defined by slicers or report filter selections. 
This was the biggest "gotcha" for me once I started trying to define measures on my own. For an example, suppose I have a PivotTable with no slicers or report filters. This table has rows grouped by CalendarYear. I then define a measure that uses the PREVIOUSYEAR() function without any special filter parameter. The regular SUM() for each row will show the aggregate for the CalendarYear value of that row and the measure will show the SUM() for the prior CalendarYear value. On the other hand, suppose I have a PivotTable with rows grouped by CalendarYear AND a slicer to allow the user to select one or more CalendarYear values. As soon as the user selects one particular CalendarYear value, the measure with PREVIOUSYEAR() will be blank. The slicer choice filters the data in such a way that the PREVIOUSYEAR() function has no data to work with in that context. The only way around this is to add an ALL() filter parameter to the PREVIOUSYEAR() function. By adding ALL(CalendarYear) to the function's filter parameters, the measure is able to explicitly ignore the CalendarYear slicer filter and locate the rows of data it needs for the measure to work.
  • There is no NULL in DAX. 
Instead, DAX identifies NULL, empty, and 0 values all as "blank" values, represented in the DAX language as BLANK(). Instead of using ISNULL() to determine if a value is null, as you would in VisualBasic, the command in DAX is ISBLANK().

As I use PowerPivot and DAX more in the future, I'm sure I'll run across more gotchas and tips, and I'll share them in my blog. If you have a tip to share, please share it in a comment on this post. We'll learn together!

Sunday, December 11, 2011

Use FOR XML to Create a Delimited List

In the past few years there have been only a handful of ideas that have revolutionized the way I write queries. Common table expressions ares one, and so are window functions. Both of those came along in SQL Server 2005, and so did the revolutionary idea I'm going to share today: the FOR XML function.

I am the first to admit that I am not an XML expert; in fact, I don't know much about it at all, but interestingly I use FOR XML to achieve a result that doesn't have anything to do with XML; rather, I use it to turn a set of rows into a comma delimited list. I can't even take the credit for the idea of using FOR XML in this way. About the only "new" approach I will take credit for is moving the approach out of the FROM clause as a "cross apply" function and into the SELECT clause as a subquery function.

I think perhaps the best way to explain this is to take a simple example and break it down into its component parts, one portion of the query at a time. In Shelby v.5's ShelbyQUERY module the following query will return one per person, and each row will have a comma delimited list of phone numbers for that person. The bold portion is the "primary query" that returns one row per person in the database. Each row contains the NameCounter and the full name, first and last concatenated together.


select
 NameCounter,
 Name = FirstMiddle + ' ' + LastName,
 PhoneList = stuff((select ', ' + Descr + ': ' + PhoneNu from Shelby.NAPhones p inner join Shelby.NAPhoneTypes t on p.PhoneCounter = t.Counter where p.NameCounter = n.NameCounter order by t.Counter for xml path('')), 1, 2, '')
from Shelby.NANames n


Now let's break down the column that constructs the phone list. It will make the most sense to work from the inside out. The bold portion below is a subquery that returns all of the phone numbers (and their type information) for each name. Normally this would trigger an error because subqueries in the SELECT clause cannot return more than one row of results. The FOR XML clause will allow us to ignore that rule in a way. Notice that the subquery includes an ORDER BY clause to sort the results. Notice that the subquery adds a comma in front of every value returned.

select
 NameCounter,
 Name = FirstMiddle + ' ' + LastName,
 PhoneList = stuff((select ', ' + Descr + ': ' + PhoneNu from Shelby.NAPhones p inner join Shelby.NAPhoneTypes t on p.PhoneCounter = t.Counter where p.NameCounter = n.NameCounter order by t.Counter for xml path('')), 1, 2, '')
from Shelby.NANames n


The FOR XML clause finishes off the subquery. The PATH('') specification tells the FOR XML function to return one row of values separated by a space.

select
 NameCounter,
 Name = FirstMiddle + ' ' + LastName,
 PhoneList = stuff((select ', ' + Descr + ': ' + PhoneNu from Shelby.NAPhones p inner join Shelby.NAPhoneTypes t on p.PhoneCounter = t.Counter where p.NameCounter = n.NameCounter order by t.Counter for xml path('')), 1, 2, '')
from Shelby.NANames n


Finally, the STUFF() function takes the first two characters from the string returned by the subquery and replaces them with an empty string (thereby cutting off the extra comma at the front of the string).

select
 NameCounter,
 Name = FirstMiddle + ' ' + LastName,
 PhoneList = stuff((select ', ' + Descr + ': ' + PhoneNu from Shelby.NAPhones p inner join Shelby.NAPhoneTypes t on p.PhoneCounter = t.Counter where p.NameCounter = n.NameCounter order by t.Counter for xml path('')), 1, 2, '')
from Shelby.NANames n


To give you a little more of a taste of how this function can work for you, here is a query that includes the phone list created above plus a list of Servant module profiles and a list of children for the individual.

select
 NameCounter,
 Name = FirstMiddle + ' ' + LastName,
 ServantProfiles = stuff((select ', ' + Profile from Shelby.NAProfiles p where p.NameCounter = n.NameCounter and p.Profile like 'Z%' order by Profile for xml path('')), 1, 2, ''),
 PhoneList = stuff((select ', ' + Descr + ': ' + PhoneNu from Shelby.NAPhones p inner join Shelby.NAPhoneTypes t on p.PhoneCounter = t.Counter where p.NameCounter = n.NameCounter order by t.Counter for xml path('')), 1, 2, ''),
 Children = stuff((select ', ' + c.FirstMiddle from Shelby.NANames c where c.FamNu = n.FamNu and n.UnitNu in (1,2) and c.UnitNu = 2 order by c.Birthdate for xml path('')), 1, 2, '')
from Shelby.NANames n

Sunday, November 6, 2011

SQL Saturday #96 Wrap-Up and Top 10

SQL Saturday #96 happened in Washington, D.C. yesterday, and it was a great event. It is a special event to me because it was my first opportunity to speak at a PASS event and give back to a community that has given me much and transformed my queries for the better time and time again. If you are visiting my blog because you came to one of my sessions, please leave me some feedback on the presentation -- constructive criticism is as welcome as praise.

If you would like my PowerPoint presentations along with the .sql files I used for the demos in SQL Server Management Studio, you can download them from the SQL Saturday #96 Schedule page.

And in the same vein as my comments on the PASS Summit, I'm going to post the top ten things I learned yesterday. These are in roughly chronological order.
1. If you ever go to a SQL Saturday event, definitely use the Speed Pass and print it off before you to the venue on the day of the event. If you don't, you'll likely be in a line waiting to check in before you can join the fun.

2. Apparently Twitter or some Twitter-related organization ranks people's "influence" based on their tweets and the number of people who respond to them. This ranking is quite important to many people, and it was a point of animated discussion in the speaker's room at this event.

3. I discovered that people who are coming to T-SQL and SQL Server from Oracle and other platforms can benefit from an introductory course such as my introduction to Common Table Expressions, even when their time of experience with SQL is greater than mine. I suppose this is self-evident, but it was a little eye-opening to me.

4. Even though features have been around since SQL Server 2005, some people who have been using T-SQL for a long time may have overlooked a feature that I take for granted now, such as the window functions. I was a little pleased when I heard a couple of attendees express surprise that it is possible to generate an aggregate value without a GROUP BY clause because it meant that I had something to share that I knew could help them tremendously.

5. Receiving applause for a presentation is truly gratifying, even when it is a customary act done for every presenter. It seemed authentic in both my sessions, and therefore it was meaningful to me.

6. It seems that for most Business Intelligence professionals, having the primary justification for having a data warehouse is the ability to create an OLAP cube for analysis. I'm not sure that will be my justification. I think its primary benefit as a companion to our OLTP database would be to capture historical data for slowly changing dimensions and a close second or even a tie for first would be to enable a clearer semantic model for our end users in report design.

7. The date dimension generally adds the most overhead to any OLAP cube because it generally adds 365 rows x however many years are tracked. If there is any way to summarize to the weekly granularity or less, that will be a huge win for the efficiency of the cube.

8. It is ever clearer that any data warehouse that might be built as a companion for the Shelby v.5 OLTP database will include a single "EntityNames" role-playing dimension that contains all the entity attributes across all the available modules supplemented with views that take the core table and breaks out the module-specific attributes.

9. Even a large software company like Microsoft can overlook a feature that the end user sees as patently obvious. The case in point for today is the ability to update automatically all the Reporting Services reports that use a report part that has been changed. It's a manual process for now.

10. The built-in change tracking mechanism in SQL Server may be a great option for customers who want to know when things have changed at a more detailed granularity than we capture in the OLTP tables. But it only captures three days' changes by default, so a secondary mechanism for moving that data to a flat file or supplemental table is needed to go further back from there.

There you have it, my top 10 things learned yesterday at SQL Saturday #96. I'll return to blogging more procedural stuff after today. Let me finish this entry by saying that I really enjoyed the privilege of sharing my knowledge with the PASS community, and I hope to have similar opportunities in the future. If I do, you'll definitely be reading about it here. :-)

Followers