
NOTE: In all the examples to follow I will use a typical data source and a dataset, but I am only going to show screenshots of the tablix structure and options related to the topic of repeating headers. The actual data are moot to the process of getting the headers to repeat.
Before exploring the solutions for repeating headers, I will walk through steps to highlight the cause of much frustration with it comes to trying to make headers repeat.
Step 1: Add a table to your report. Notice that the top row of the table is labeled "Header."

Step 2: Add whatever fields you want to the data row.
Step 3: Open the tablix properties of the table. Put a check mark next to "Repeat header rows on each page." Click OK.

Step 4: Run the report. Notice that the header rows do not repeat on each page!
This is the usually the beginning point of frustration with making header rows repeat. It has caused me (and probably others too) to shout at the computer, "Why aren't you doing what I'm telling you to do?!?!"
[Spoiler: "Repeat header rows on each page" doesn't really mean what it says. It means, "Repeat the header region of a row group on each page whenever the content is too wide to fit on one page and generates one or more extra pages." I guess that was too much verbiage for the programmers to fit.]
[Spoiler: "Repeat header rows on each page" doesn't really mean what it says. It means, "Repeat the header region of a row group on each page whenever the content is too wide to fit on one page and generates one or more extra pages." I guess that was too much verbiage for the programmers to fit.]
The following steps explain how to get Reporting Services to do what you want it to do and repeat the information you want repeated.
Repeat Rows or Columns for a Table with No Groups
A static row is any row that is outside of any data-driven section of the tablix. This means it is not the (Details) row and it is not inside any bracketed "grouping" section either. The tablix marker that appears to the left of the row is completely empty, as shown below.

Normally static rows do not appear as items in the Row Groups section at the bottom of the design screen, but to make them repeat we need to see them. So use the drop-down choice to the right of the Column Groups label and select "Advanced Mode" to turn it on.

Click on the (Static) item under the Row Groups pane that corresponds to the row you want to repeat. Then switch to the Properties pane (press F4 to open the Properties pane if it is not already open).
Change or verify these property values:
Change or verify these property values:
- FixedData to True (to "freeze" the row in a web browser environment; this is optional)
- KeepWithGroup to After (this may be the default, but it can be changed inadvertently)
- RepeatOnNewPage to True

Now the row will repeat on each new page of the report output.
If there are too many columns to print on one page, you can also choose to repeat (and freeze) one or more columns on each page. Simply make the same change to the column's (Static) item under Column Groups that is shown above for the static row.
If there are too many columns to print on one page, you can also choose to repeat (and freeze) one or more columns on each page. Simply make the same change to the column's (Static) item under Column Groups that is shown above for the static row.
Repeat Rows and Columns in a Table with Row Groups
When you add a row group to a tablix, a vertical double-dashed line divides the table and a bracket appears on the tablix frame to show the rows within the group. Within the group bracket, the region to the left of the double-dashed line is the "row header" region. To the right of the double-dashed line is the details region and, if you added a row group header, a static row (technically only a partial row) above the details region. The diagram below shows each region with arrows pointing to the corresponding item in the Row Groups pane. As mentioned above, to see the (Static) items, the pane must be in Advanced mode.
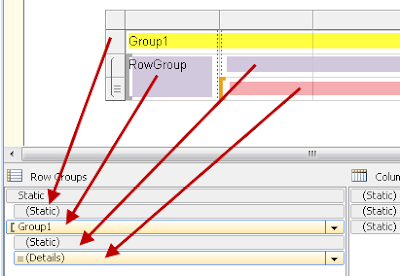
All static rows, including the partial header row inside the group, can be repeated on each page using the technique explained above. The row header region will reprint the field value at the top of each page by default, so normally there is nothing you need to do with it. However, if you have too many columns to fit the page, you can also repeat the row header region on the pages with the excess horizontal content. To do this, open the tablix properties and put a check beside "Repeat header rows on each page." (Of course it is not "rows" that are repeated but the row header column. This is part of what makes the option unclear.) If you want the row header region to stay on the screen when the report user scrolls horizontally, also check the box to "Keep header visible while scrolling."


All static rows, including the partial header row inside the group, can be repeated on each page using the technique explained above. The row header region will reprint the field value at the top of each page by default, so normally there is nothing you need to do with it. However, if you have too many columns to fit the page, you can also repeat the row header region on the pages with the excess horizontal content. To do this, open the tablix properties and put a check beside "Repeat header rows on each page." (Of course it is not "rows" that are repeated but the row header column. This is part of what makes the option unclear.) If you want the row header region to stay on the screen when the report user scrolls horizontally, also check the box to "Keep header visible while scrolling."

Repeats Rows and Columns in a Table with Column Groups
Like a row group, a column group in a table (or matrix) also has a double-dashed line dividing the details region below the line from the column header region above the line. Making static rows and columns (or the partial "header" segments that are also static) works just as described above for static items. Making the column header region repeat works like making the row header repeat: open the tablix properties and select "Repeat header columns on each page." (Again, it is not "columns" that repeat but the column header row. This just maintains the confusion.) When you are dealing with a matrix (which is really just a table with row groups and column groups together), this is normally the option you want to choose to make sure the columns are labelled on every page. But this is not intuitive because the wording leaves you to believe that columns will be repeating, not the header row.

Summary
Hopefully this post will help you take control of the headers you want to repeat across the pages of your report, both in print on on the screen. Here is a brief list of points to take from the discussion:
- The tablix properties for repeating headers refer only to group-header regions and have no effect on other rows or columns in the tablix.
- The phrases "header rows" and "header columns" in the tablix properties screen are misleading and basically mean the opposite of what they seem.
- To make non-group-header rows or columns repeat, first turn on the "Advanced" mode of the group pane at the bottom of the design screen, then set the properties of the corresponding (Static) item so that RepeatOnNewPage and FixedData are both true.

